It helps the trader to feel confident when using one’s data, whereas the analysis quality gets improved. You can analyze information from your trading journal with the help of 69 indicators and approximately 150 charts and diagrams.
Trading analysis: is a learning tool which helps to identify which of your activities generate the biggest profit and which send your deposit down. In conjunction with the MaxProfit strategy tester – a powerful instrument for manual testing of any strategy in use trading analysis module keeps every little detail of your trading under control. You can examine your trading, find the consistent patterns and get quality information by pre-set parameters. It will help to identify which types of trades are better to ignore and which can perform with increased volumes. You can create different reports and harmonize them according to your requirements and all your presets saved for future analysis of various types – evaluation of profitability results, traded volumes, working capital, average profit and loss, net income, cost of commissions, etc. This data helps you to visualize the area you have done well and where you can improve.
Trading analysis: is designed to perfect the trading system. The data collected in a trading journal is then processed, sorted and presented in an easy-to-understand way. That’s why it is vital to make relevant notes about every step in your trading to prevent losing essential information. Subsequently, you get a more extensive fundamental data which improves your trading performance. It’s the best way to take a look at oneself from an outside perspective.
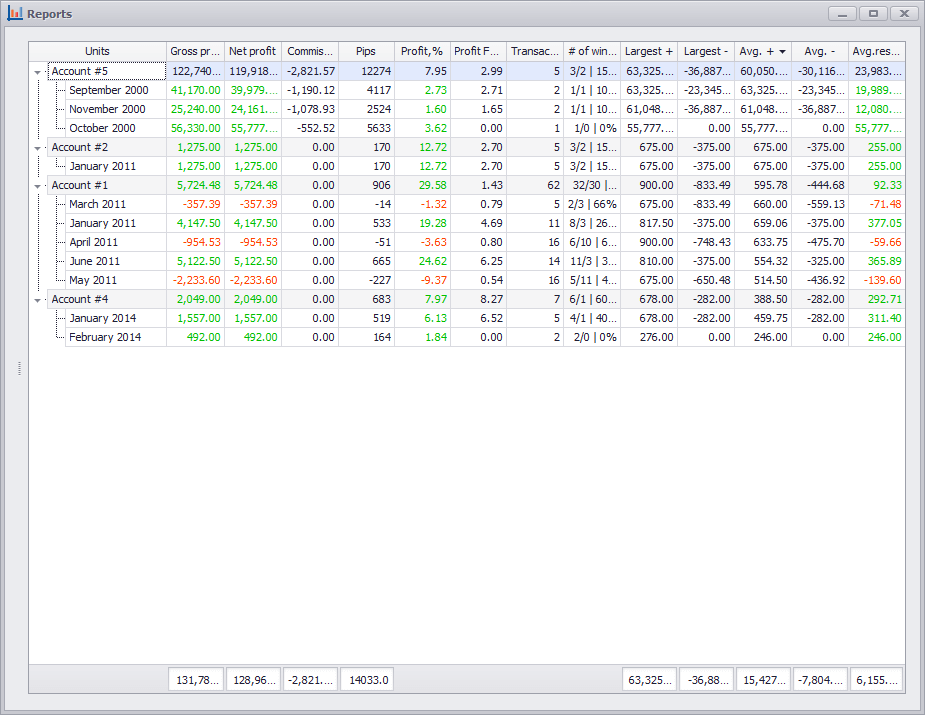
In our opinion, we shall start with the most interesting and useful - with user reports. In any case, it's as useful as the Sortino or Sharpe ratio.
For example, we added 2 properties:
You can create different properties on your own.
In transactions, we set values for each property (we'll give more details on this subject below).
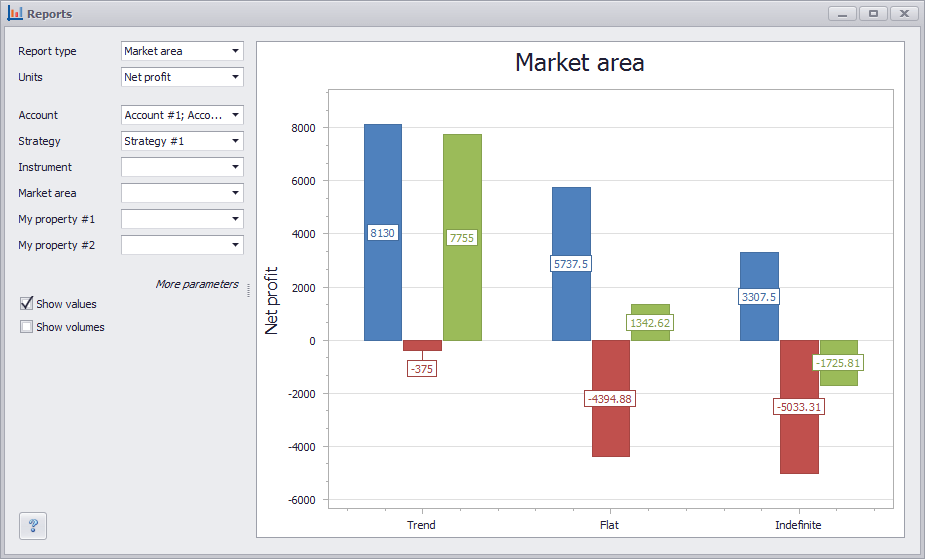
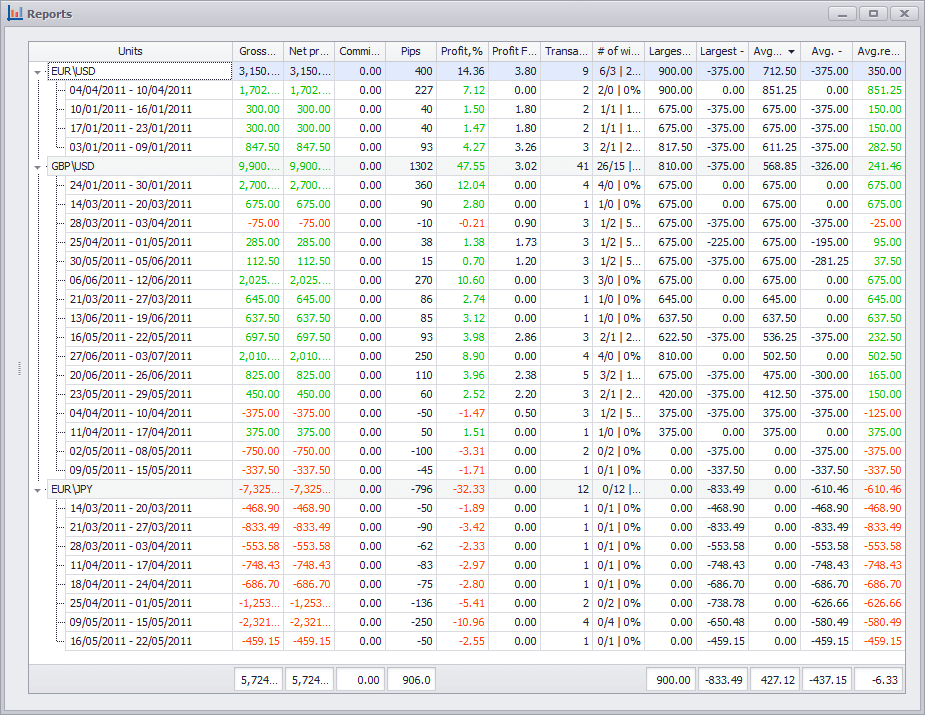
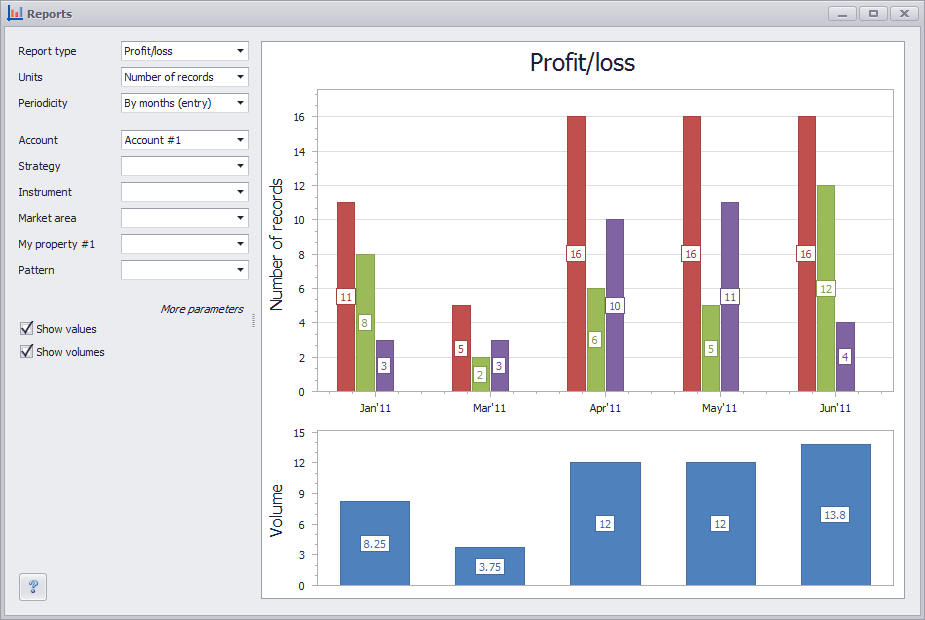
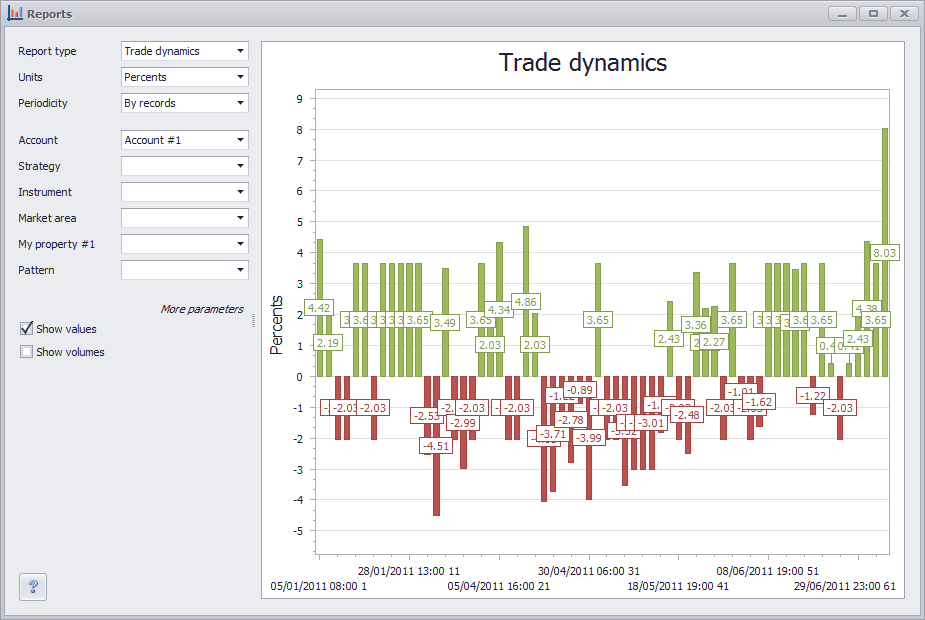
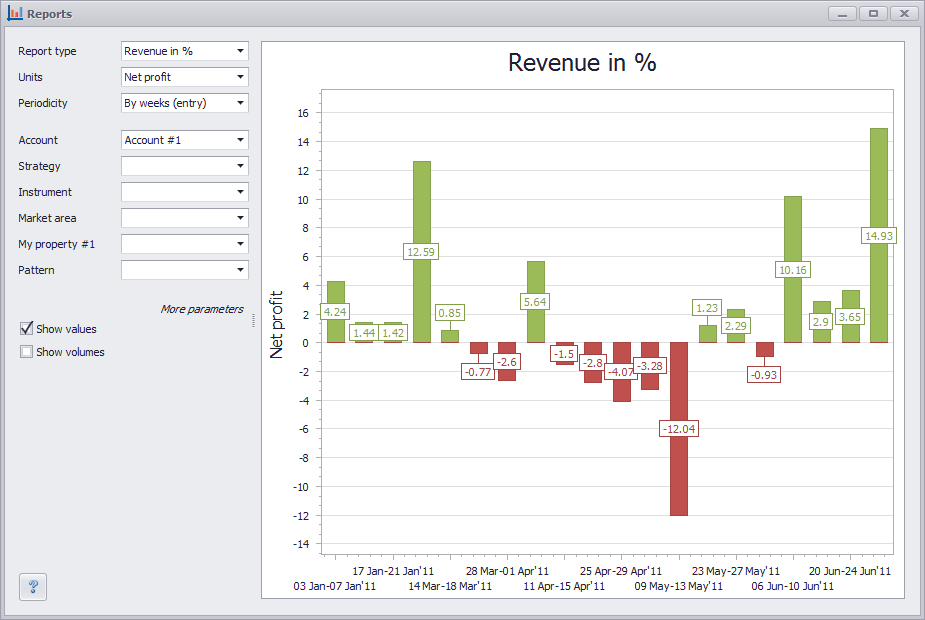
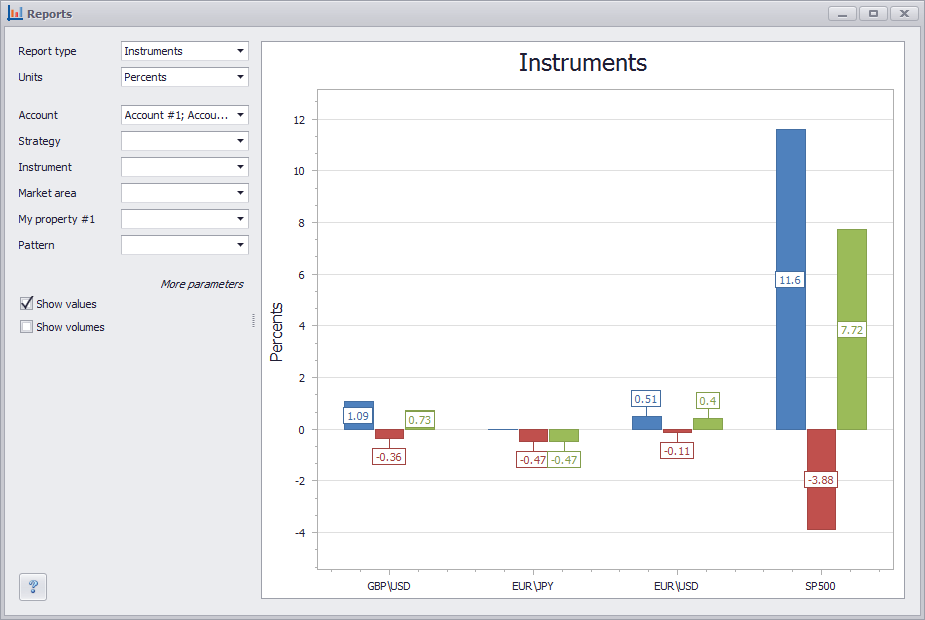
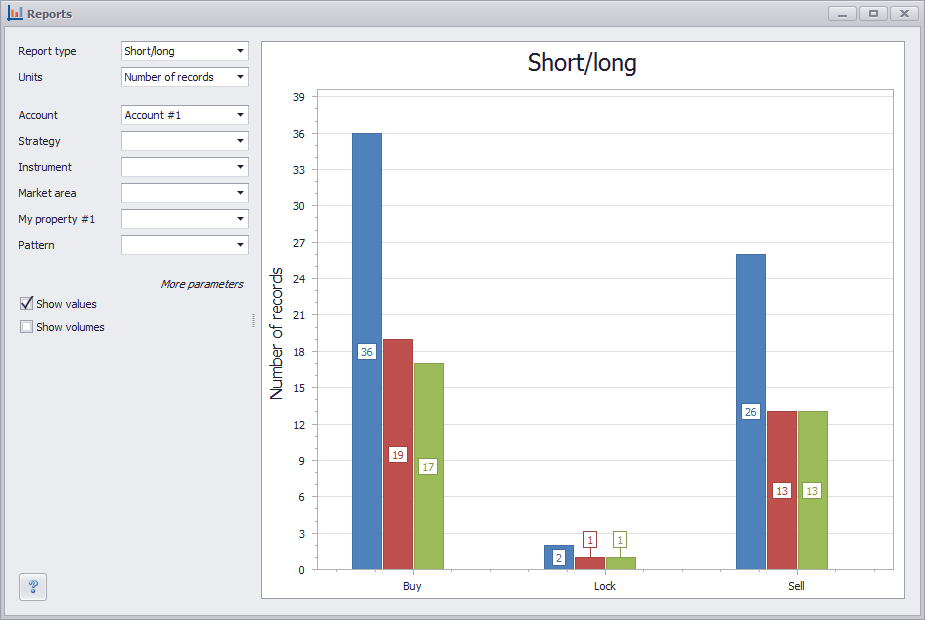
What does it give us? After adding a new property, a new report type with the same name appears in the reports. Open the report form and select 'Market area' as the report type. Let's see what we get:
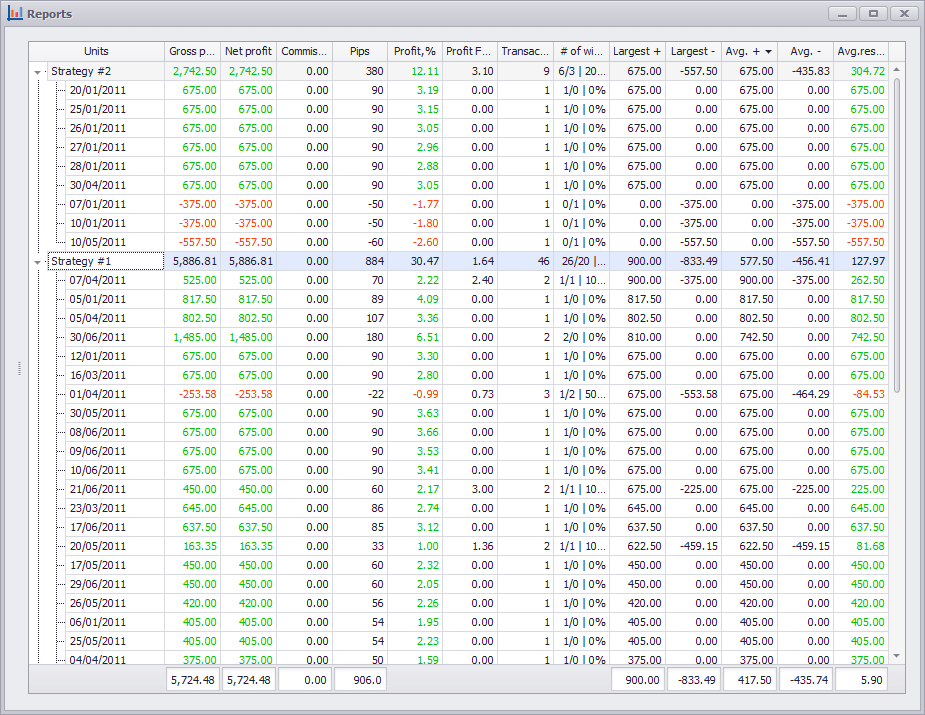
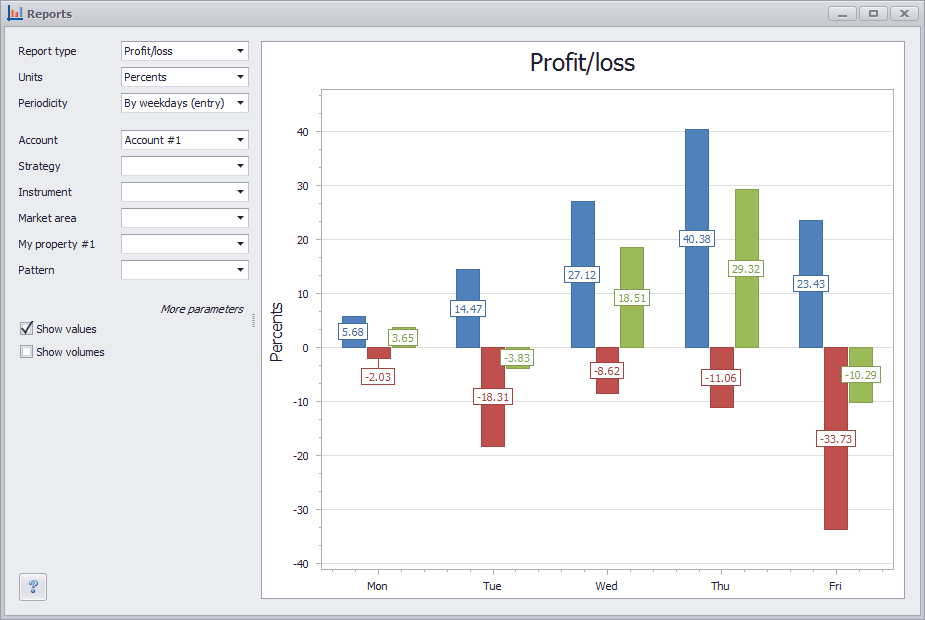
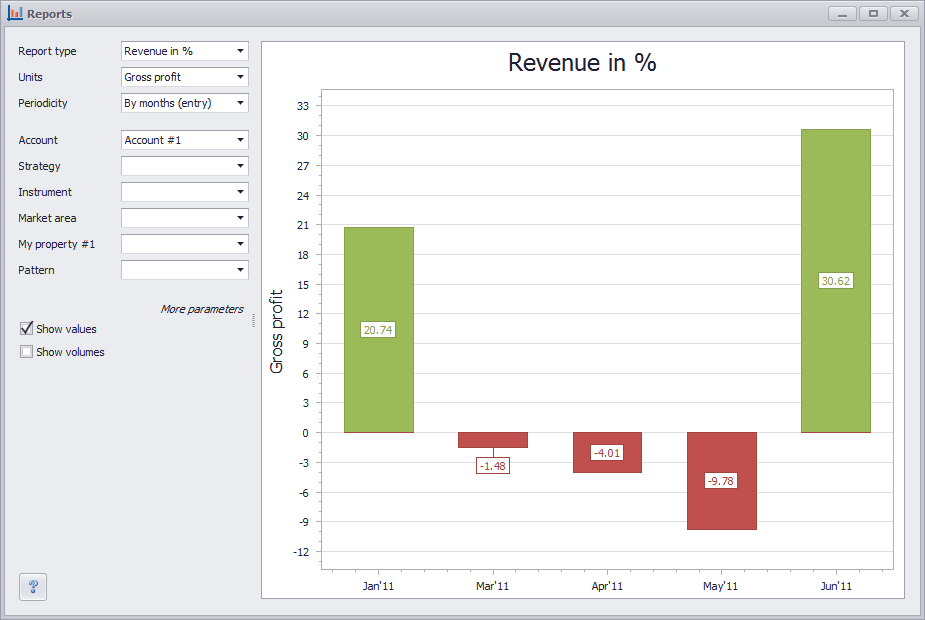
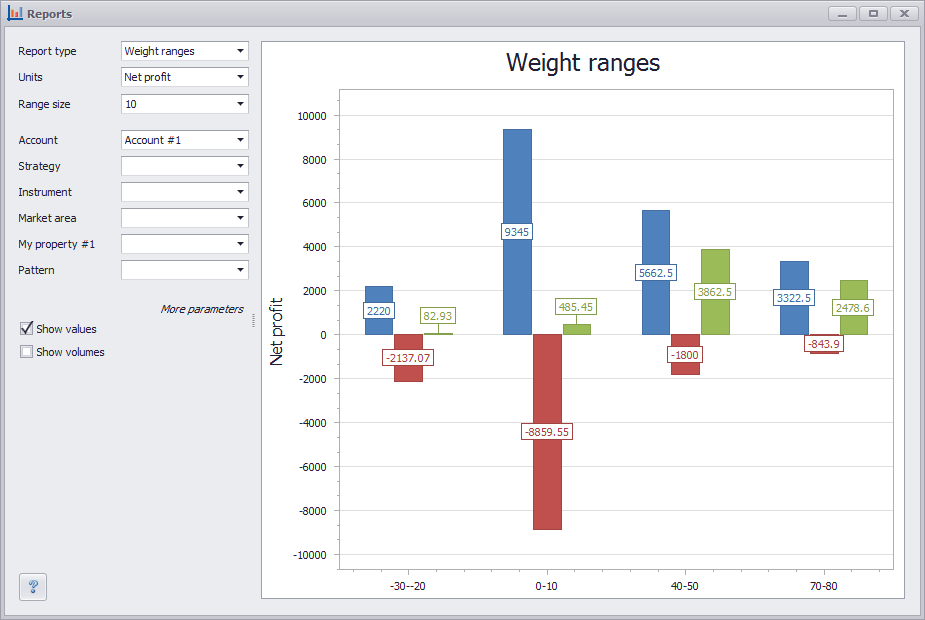
Let's draw up the second report with the 'Pattern' property:
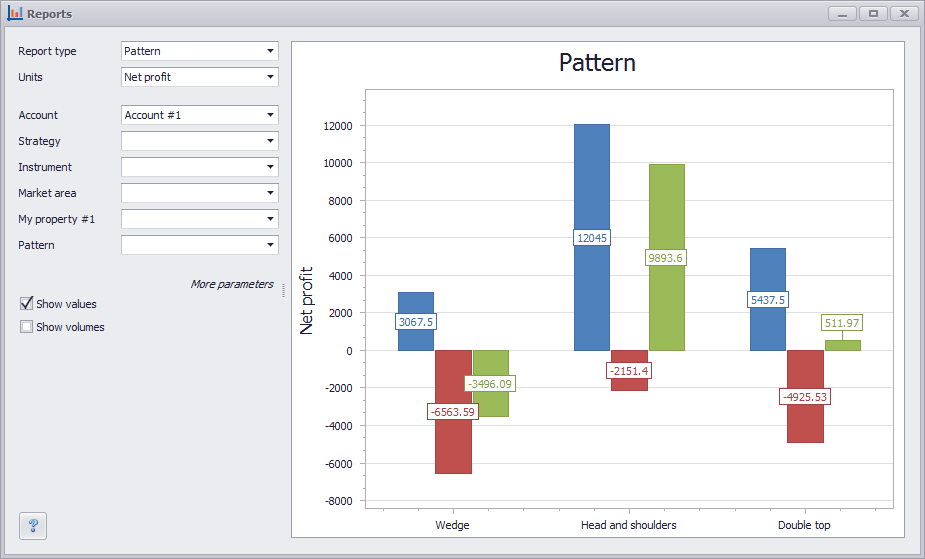
What conclusion can we make? Using our trading system you should not work with 'Indefinite' area of the market, as well as with figures 'Wedge' since according to statistics we bear losses using them. It is better to refrain from working with such area and finalize our strategy.
Let's see how we added properties. To do this, we opened the 'Properties' directory (Menu --> Directories --> Properties), clicked the 'Add' button and filled out the forms as follows:
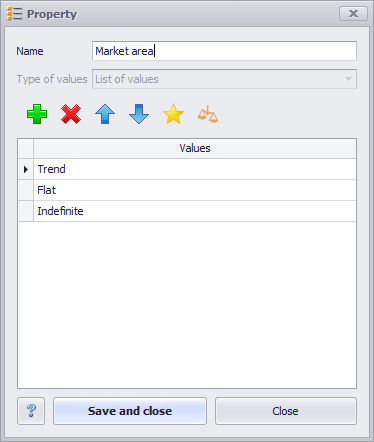
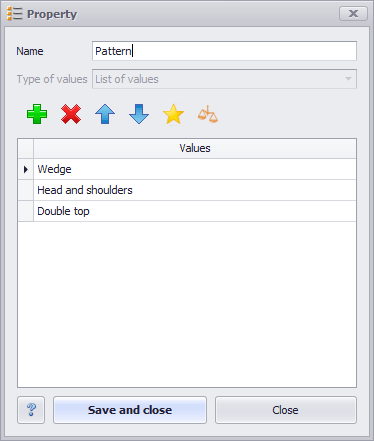
After we created new properties, new columns were added to the Trading journal and this allowed us to set values for each property in transactions
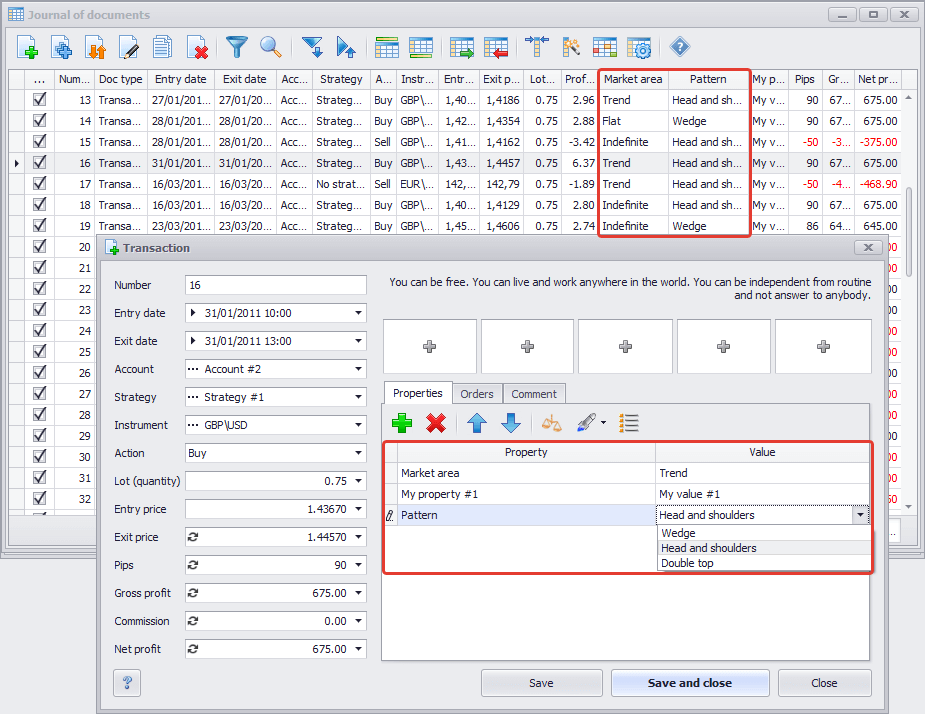
Transaction properties make up a powerful tool for every trader, allowing you to analyze your trade as profoundly as possible and get detailed statistics on your trading systems. Be sure to use them in your work, without the statistics looking inferior.
Traders express different opinions and constantly argue about what should markers of successful trade be like, what should be their maximum or minimum level, and we do not intend to give a specific and clear answer for each value. Our task is to reflect real markers in statistics, i.e. correctly calculate them based on your data using common formulas, and to show formulas we use.
The 'Result table' report contains values for 92 different markers. Let us consider only some of the most important ones.
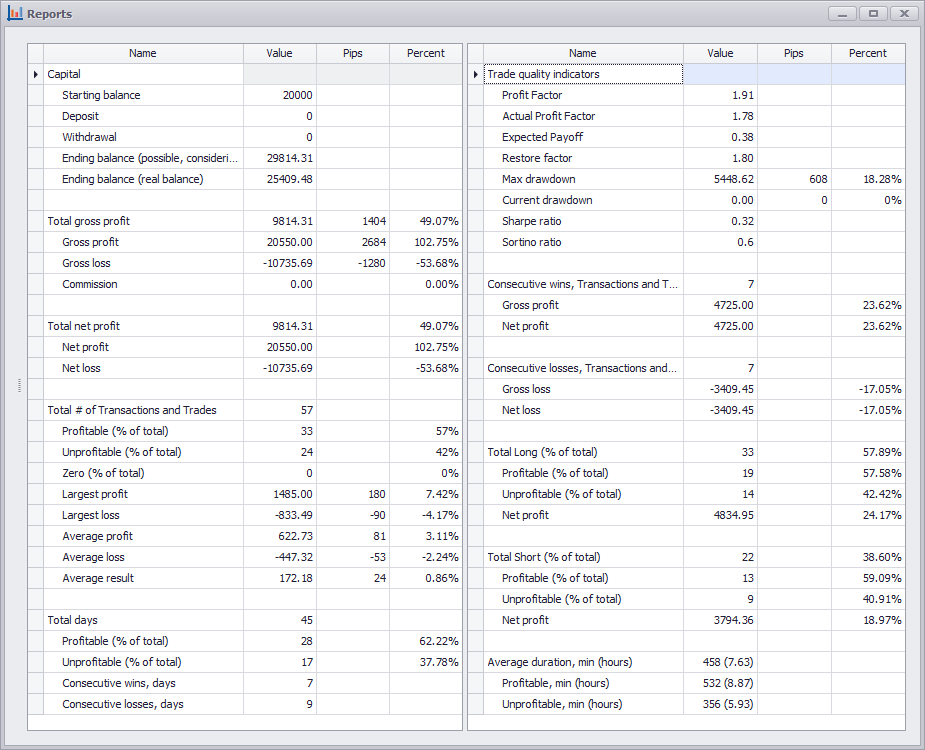
Profit factor = Amount sum of profitable transactions / Amount sum of unprofitable transactions
Beginners are usually told that the profit factor should be at least 2 to 1. Professionals are not satisfied even with 5 to 1.
Profit factor can be calculated both for the entire period of trade and for a certain period of time. Let's consider an example. In January, the amount sum of all profitable transactions was $1000. For the same period of time, the amount of all unprofitable transactions was $400. So profit factor = 1000 / 400 = 2.5 or 2.5 to 1.
If you have not set a date filter in the report, the profit factor will be calculated for the entire period of time
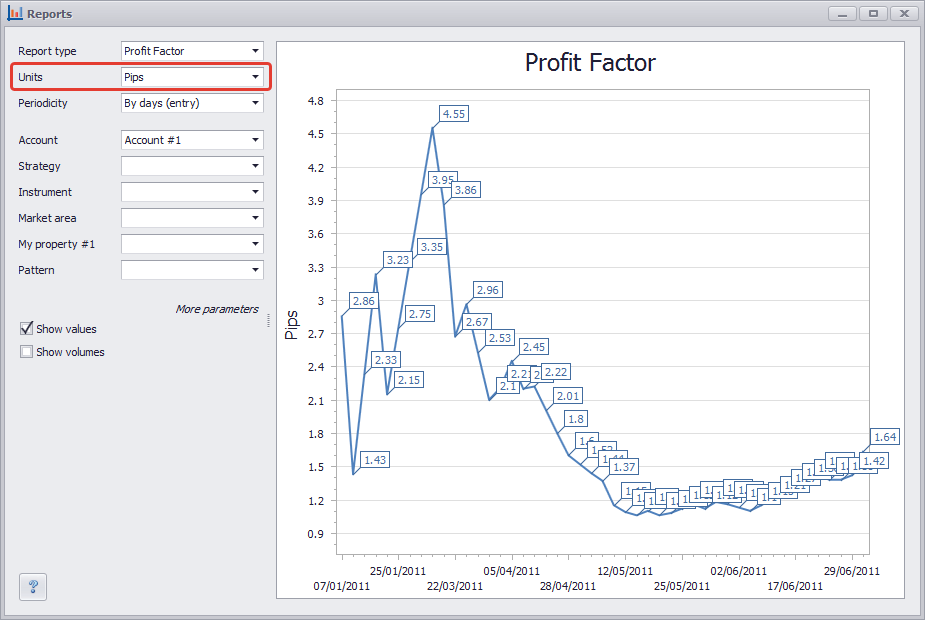
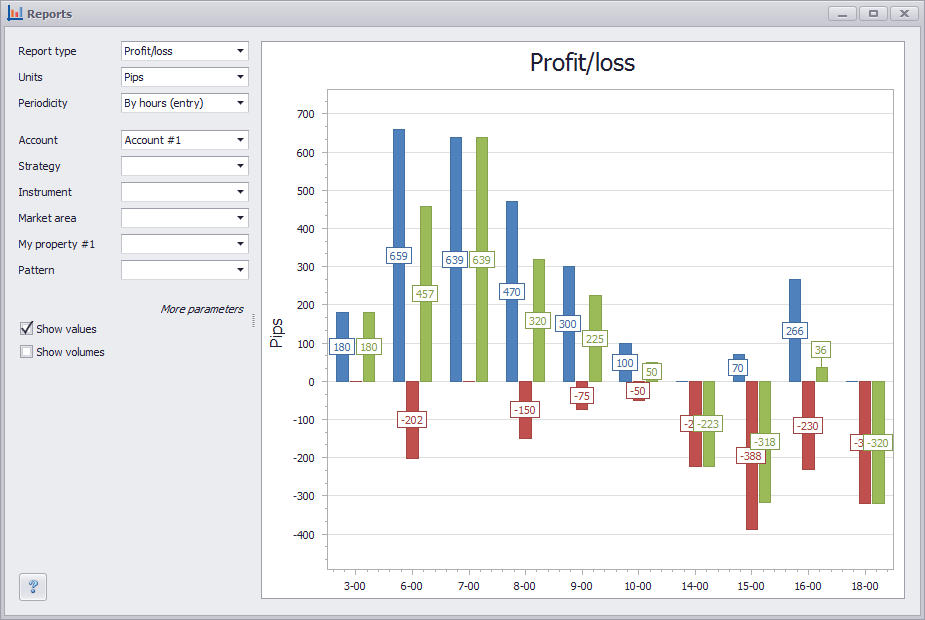
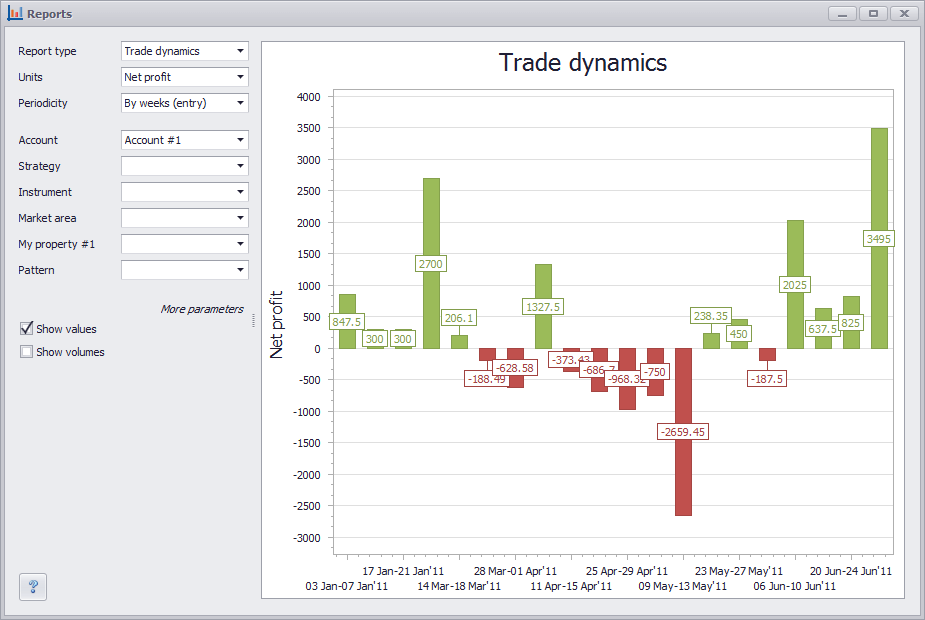
Since we're talking about profit factor, we should take a look at another graph with the same name 'Profit factor'
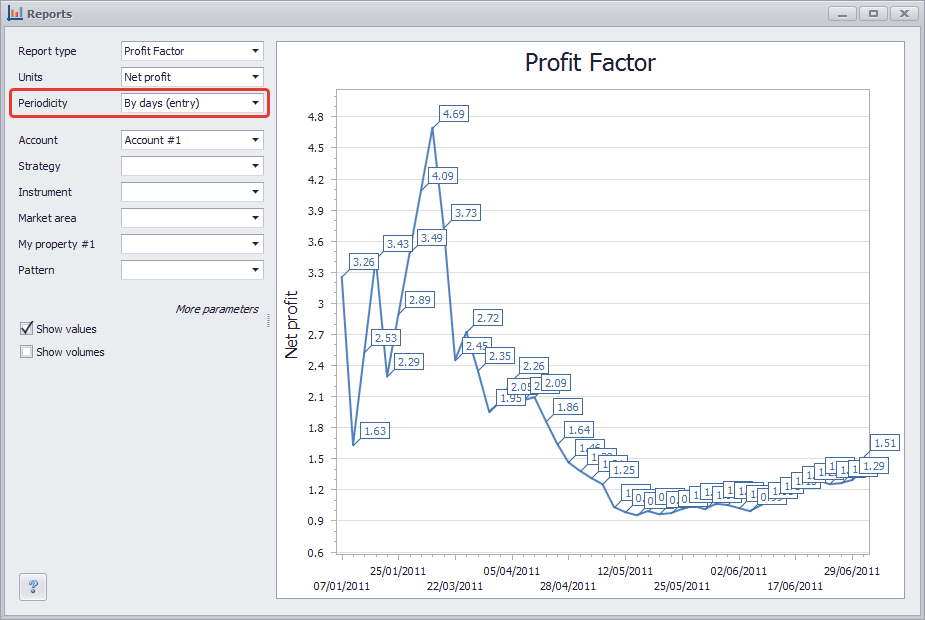
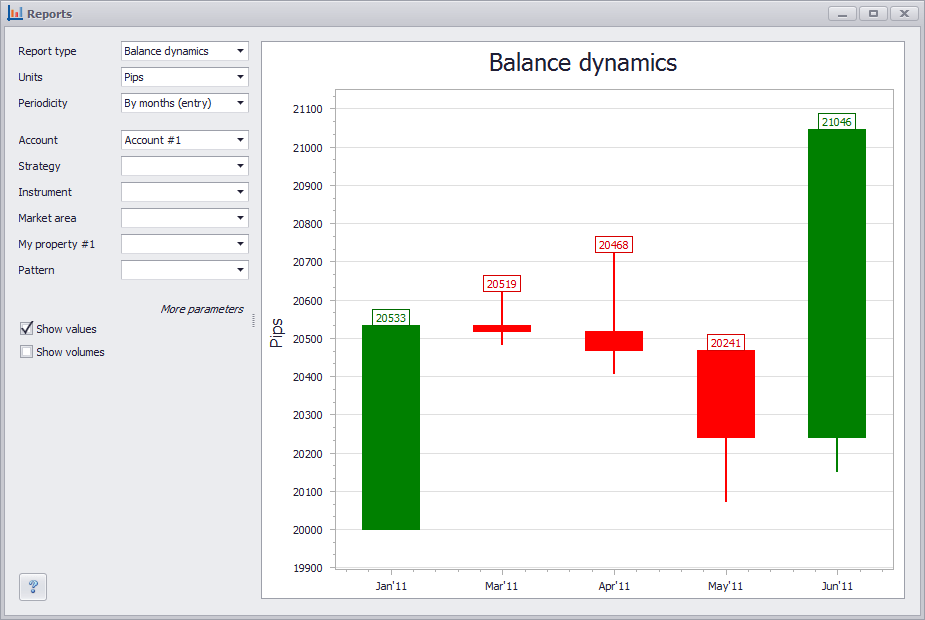
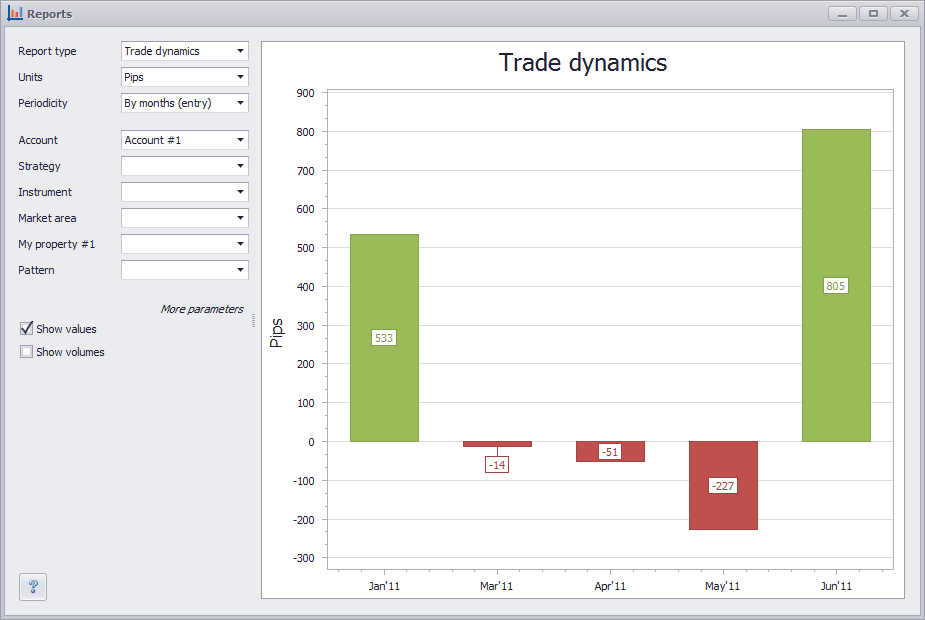
The above graph was built 'By day'. I.e. it shows how that marker has changed day by day. Now let's draw it up by month

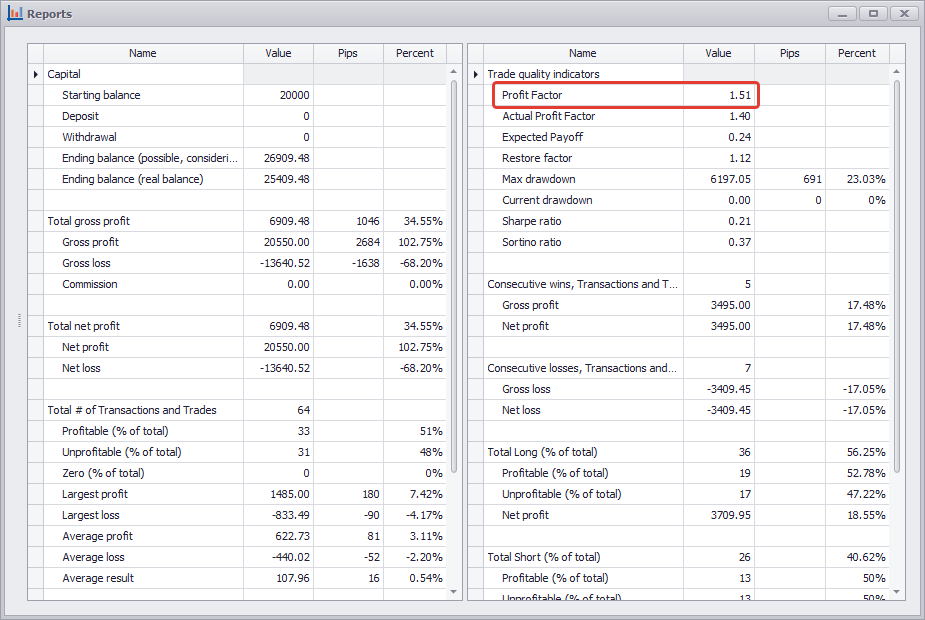
Let's look at one more graph, but this time in the marker field we choose 'Points' instead of 'Net profit'. Usually no one calculates the profit factor in points, but in fact, they should. You can get interesting information from this. So, what do we see? 2 different profit factors, the first one is equal to 1.51, the second is 1.64. I.e. a profit factor drawn up by points has a higher value. How can this be? Most likely when trading we incorrectly calculated a lot. It often happens that by points we benefit and by sum, we lose. To avoid this it is essential to calculate a lot at all times. The calculation formula is almost the same:
Profit factor = Sum of profitable transaction points / Sum of unprofitable transaction points
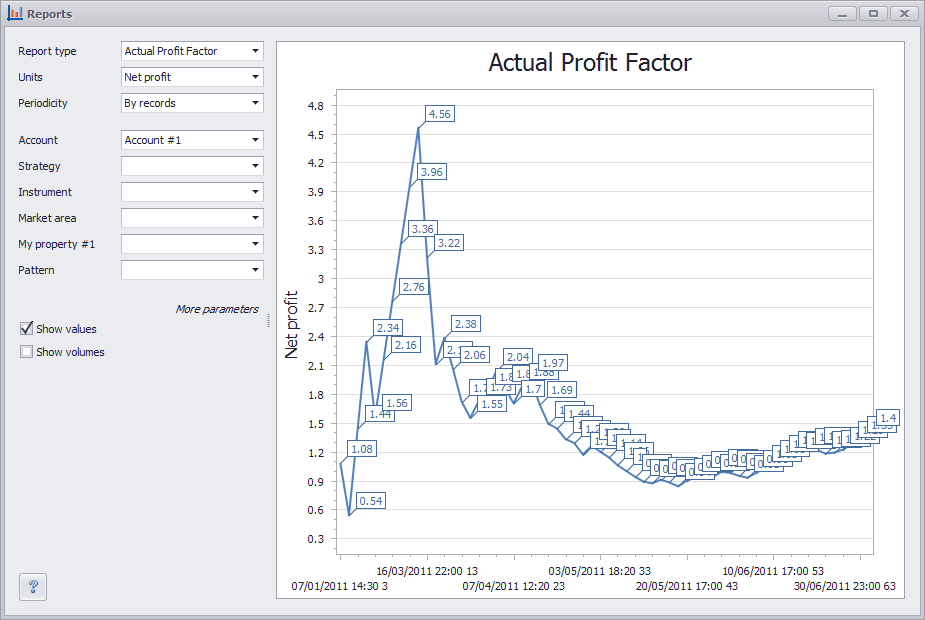
Actual profit factor = (Amount sum of profitable transactions - Result of the most profitable transaction) / Amount sum of unprofitable transactions
It is believed that, by deducting the result of the most profitable transaction from the amount sum of profitable transactions, we get a more accurate and reliable result.
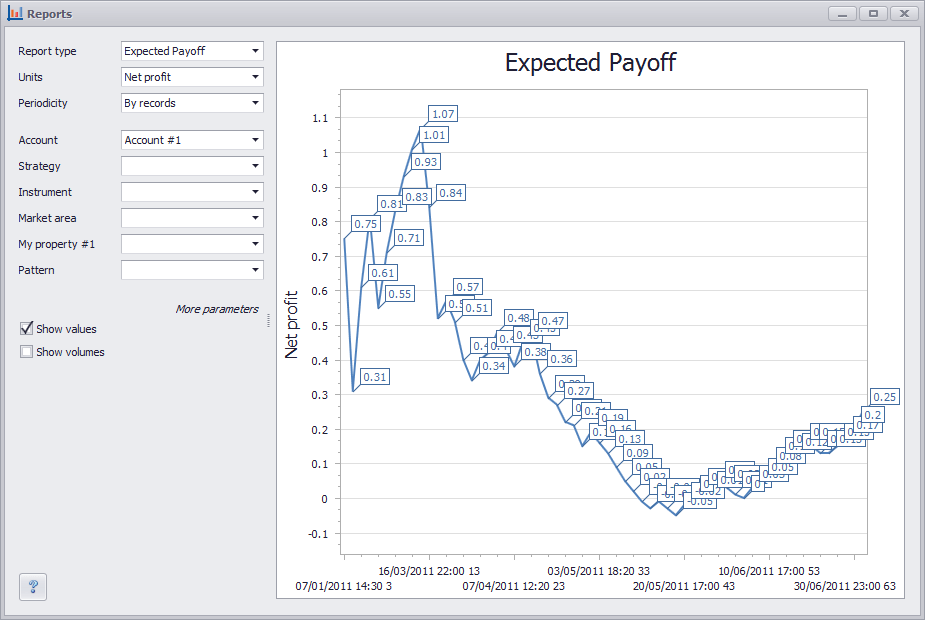
Exp. payoff = (1 + (Average profit / Average loss)) * (Number of profitable transactions / Total transactions) - 1
Most importantly, this marker must be positive. If it is negative, it means that we will lose the entire deposit soon, if we continue to trade in the same strain. The higher it is the better. Let's substitute values in this formula.
Average profitable transaction = $80
Average unprofitable transaction = $30
The number of profitable transactions = 40
Total transactions = 100
Exp. payoff = (1 + ($80 / $30)) * (40 / 100) - 1 = 0,46
For a more visual example and in order to understand how the expected payoff changes over time we can construct a graph with the same name. It can be constructed using different periodicity: By transactions, by days, by weeks and by months. We will construct it by days and see how the expected payoff has been changing day by day
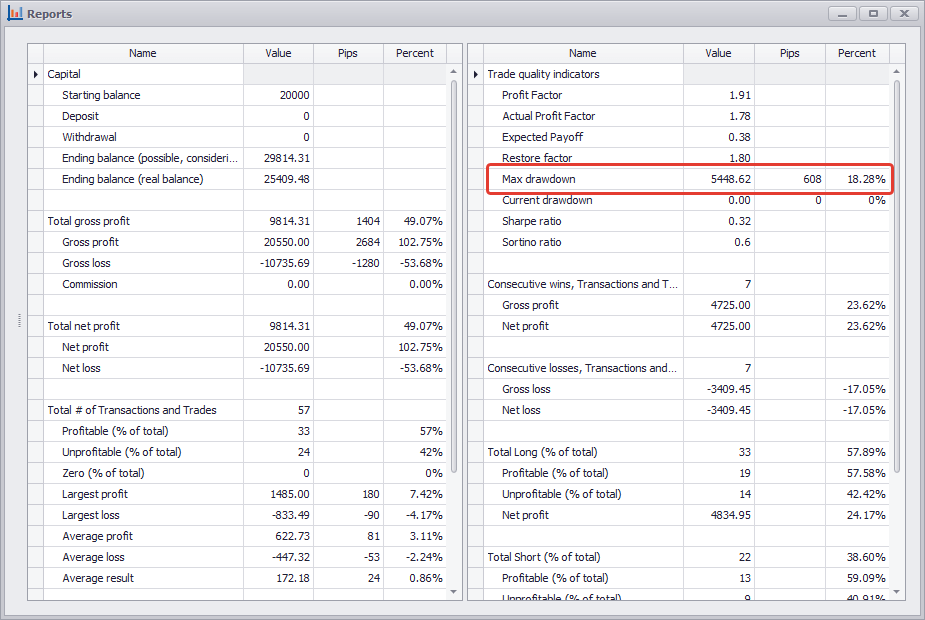
Maximum drawdown = Maximum difference between the maximum and minimum account balance
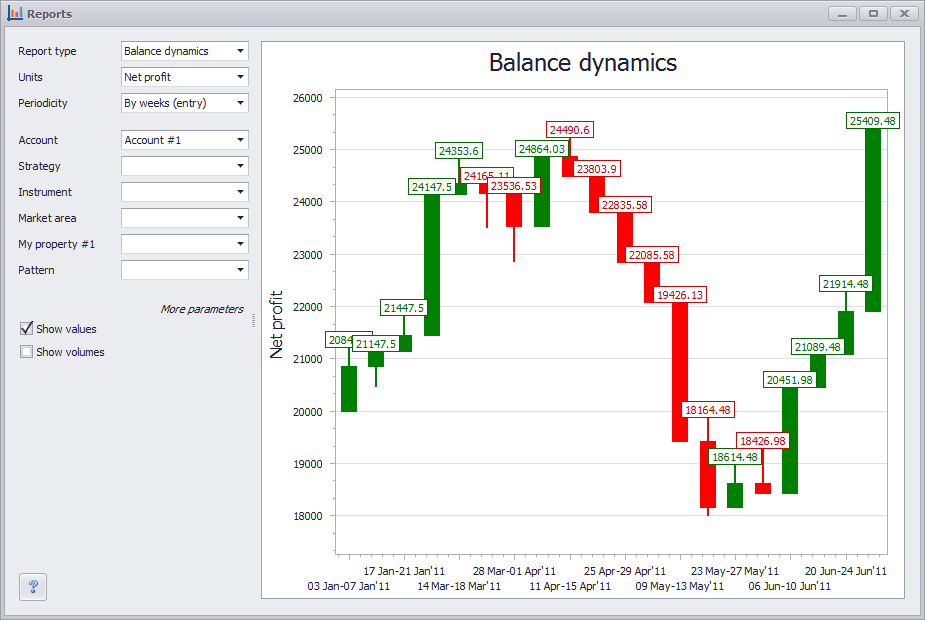
For better understanding let's look at the 'Capital curve' graph
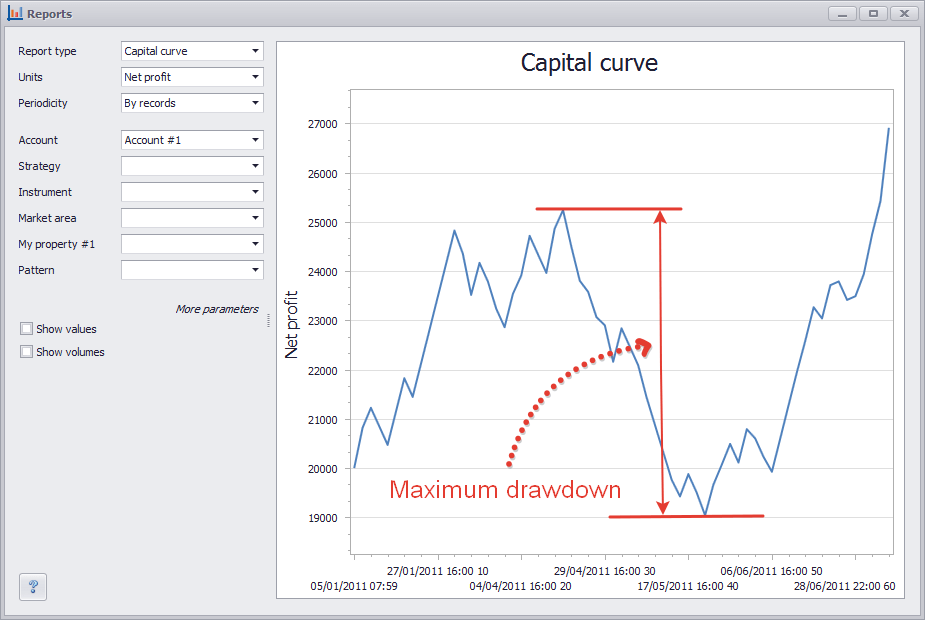
In the 'Result table' table we show the Maximum drawdown in currency, in points and in percents
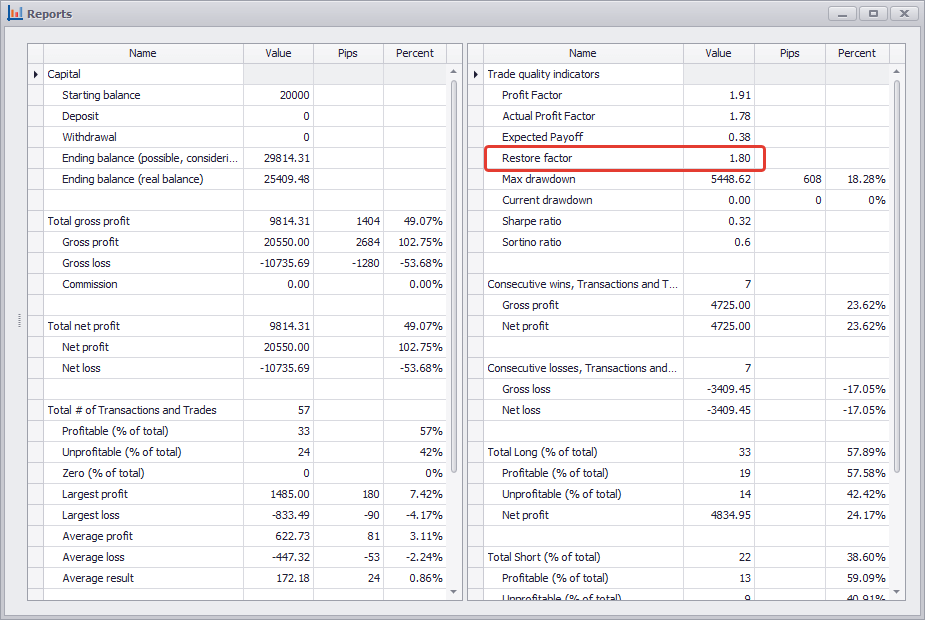
Recovery factor = Net profit / Maximum drawdown
It is believed that the higher the recovery factor is, the faster our trade is recovering from drawdowns. If you compare 2 trading system (TS), the one with the smaller recovery factor will be worse. Assume that the TS No. 1 has earned us 150% at a drawdown of 50%; its profit factor will be 3. And TS No. 2 has given us just 50% at a drawdown of 10%. Its profit factor will equal to 5, and therefore it will be better than TS No. 1. The profitability of TS No. 2 can be easily increased to 100% through the use of higher leverage.


© 2009-2026. MaxProfit Global LLC All rights reserved
Disclaimer: MaxProfit is not a trading platform but a bundle of analytical and simulation tools. It can show the strengths and weaknesses of your performance but couldn’t guarantee you any profit. Futures, options, stocks and currency trading (including cryptocurrency) have significant potential rewards but also a high level of potential risk. You must be aware of the risks and be willing to accept them to invest in the mentioned above markets. Don’t trade with money you can’t afford to lose.


 Strategy tester
 Trading journal
 Trader’s diary
 Trading analysis